Tag: 하루·Dot

  • One Dot a Day: Daily Rating Tracker for October 2026 [Flowhere]

    One Dot a Day: Daily Rating Tracker for October 2026 [Flowhere]

    What does a month look like when you rate just one part of your day?

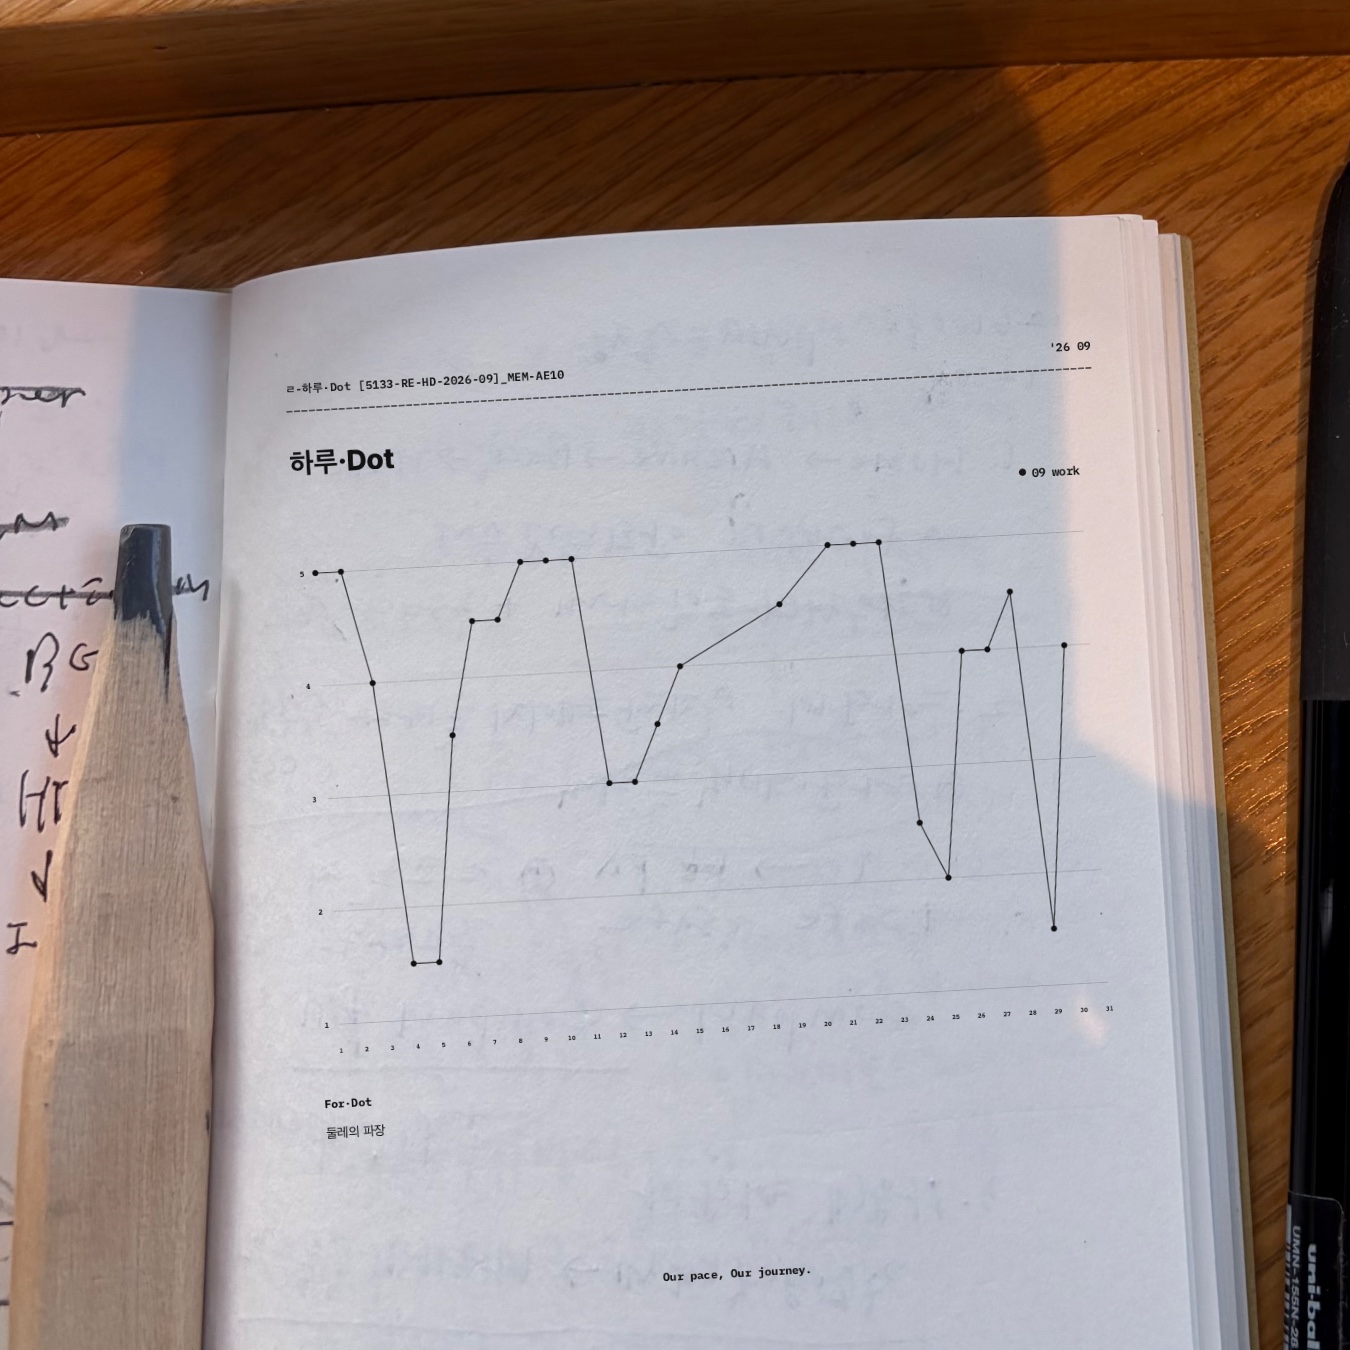
    Throughout September 2026, I used 하루·Dot to track work on a scale from 1 to 5. The result is the graph shown in the featured image: daily ratings connected into a line, revealing steady stretches, sudden drops, and changes across the month.

    하루·Dot (Haru·Dot) is a web-based daily rating tracker in Flowhere. You choose what to track, add a dot for each day you record, and see your ratings form a graph over time.

    You can start your own October record in Flowhere and export the results as PNG, JPG, or PDF for Goodnotes or your personal collection.

    September 2026: Tracking Work With One Dot a Day

    The featured photograph shows my actual September work ratings on a printed journal page.

    The line drops sharply near the beginning of the month, rises again, and reaches several higher points before changing direction toward the end.

    Each dot represents a rating I recorded for that day.

    The graph does not tell you what happened at work or why I chose a particular score. It shows how those personal ratings changed over time.

    Seeing the dots together makes it easier to notice a stretch of similar ratings or a sudden shift that might be less obvious when looking at individual days.

    Choose Your Lens and Record a Daily Rating

    In 하루·Dot, a Lens is the category you choose to track.

    You can use it for mood, energy, concentration, work, or another measure that matters to you. The September example uses work, but the recording method stays the same regardless of your chosen Lens.

    Tap or drag to place a rating from 1 to 5, with 0.5 increments available for more precise entries.

    Each recorded rating becomes a dot on the graph.

    Below the graph, For·Dot gives you space to add a short note when a number alone is not enough. In my September record, a brief handwritten-language note appears beneath the line graph.

    From Daily Dots to a Longer-Term Graph

    하루·Dot offers four time ranges for viewing your ratings:

    1M · 3M · 6M · 1Y

    The one-month view shows daily changes in detail. A three-month, six-month, or one-year view brings more of your recorded history into the same graph.

    You continue recording in the same way. What changes is how much time you can see at once.

    Saved records can also be revisited through Flowhere’s Archive, so earlier ratings remain available when you want to look back.

    Start Your October 2026 Daily Tracker

    Open 하루·Dot in Flowhere and choose a Lens for October.

    Add your first rating, then continue on the days you want to record. You can leave a note in For·Dot and check how the graph develops as the month progresses.

    하루·Dot runs in your browser rather than as a Goodnotes template. Once you have recorded your ratings, you can export the graph as PNG, JPG, or PDF.

    Save the PDF in Goodnotes alongside your other journal pages, or keep the PNG or JPG as an image of your record. The original record remains in Flowhere for continued use.

    Prefer writing schedules, notes, and monthly reflections instead of tracking a daily rating? Reflection Monthly offers another way to record October in Flowhere.

    → Explore October 2026 Reflection Monthly in Flowhere

    One dot a day.

    𝑶𝒖𝒓 𝒑𝒂𝒄𝒆, 𝑶𝒖𝒓 𝒋𝒐𝒖𝒓𝒏𝒆𝒚.
  • One Dot a Day: A Simple Daily Mood Tracker in Flowhere — 하루·Dot [no.5133]

    One Dot a Day: A Simple Daily Mood Tracker in Flowhere — 하루·Dot [no.5133]

    Not every day needs a full journal entry.

    Sometimes one dot is enough.

    Flowhere’s 하루·Dot is a simple daily tracker that lets you place one dot on a 1–5 scale and see how those dots form a line over time.

    You decide what the dot represents—mood, energy, focus, work, physical condition, or something else you want to keep noticing.

    You can record in 0.5 steps, view your records across 1 month, 3 months, 6 months, or 1 year, and export the page as PNG, JPG, or PDF.

    The images in this post show my actual 2026 records as they appear across the 1M, 3M, 6M, and 1Y views.

    하루·Dot at a Glance

    ItemDetails
    Daily recordOne dot
    Scale1–5
    Precision0.5 steps available
    InputTap or drag
    LensChoose what you want to track
    Views1M · 3M · 6M · 1Y
    Short noteFor·Dot
    Save pageYes
    ExportPNG · JPG · PDF
    Goodnotes useExport and continue with notes or handwriting
    ArchiveRecords can continue in Flowhere

    One Dot a Day

    하루·Dot starts with a very small action: decide where today sits on your own 1–5 scale and leave one dot.

    You can use whole numbers or record in 0.5 steps when you want a little more precision.

    One dot does not need to explain the whole day.

    Its meaning comes from the Lens you choose and from the other dots that gather around it over time.

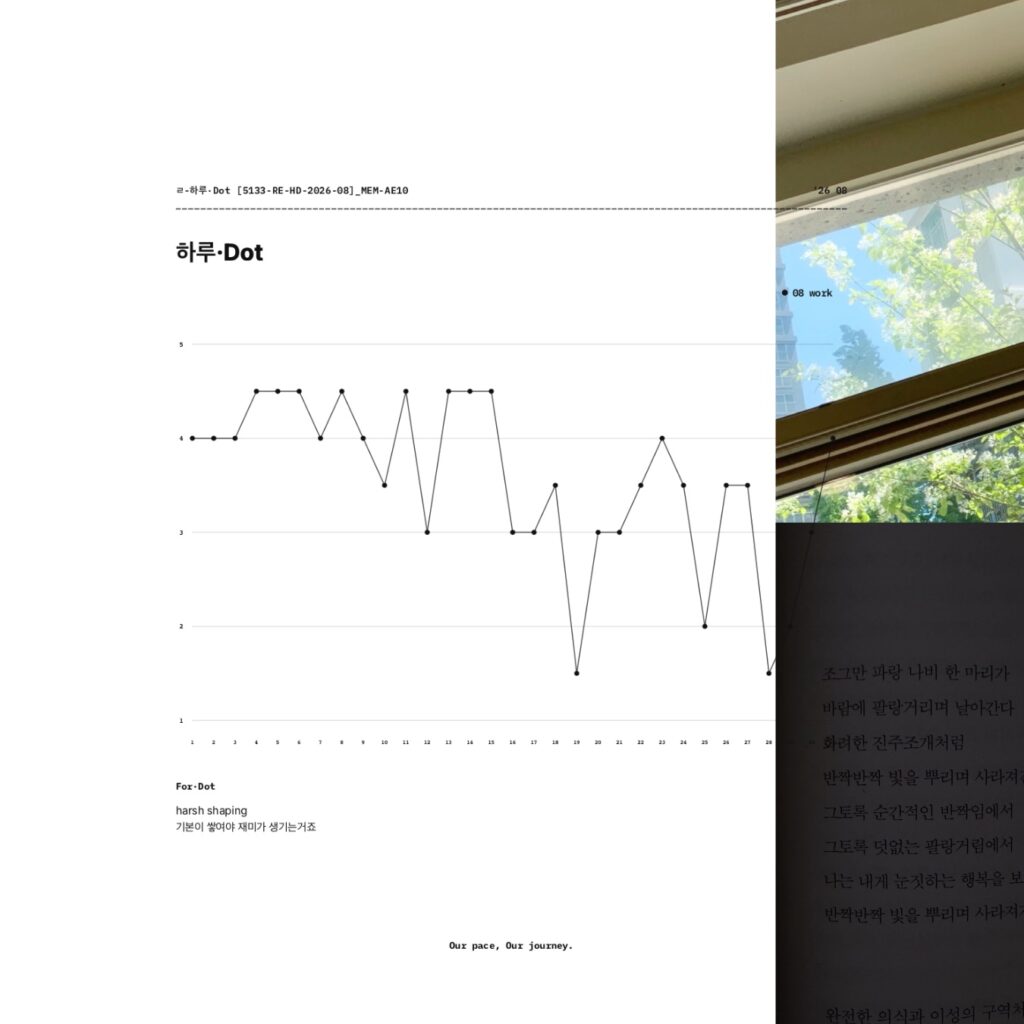
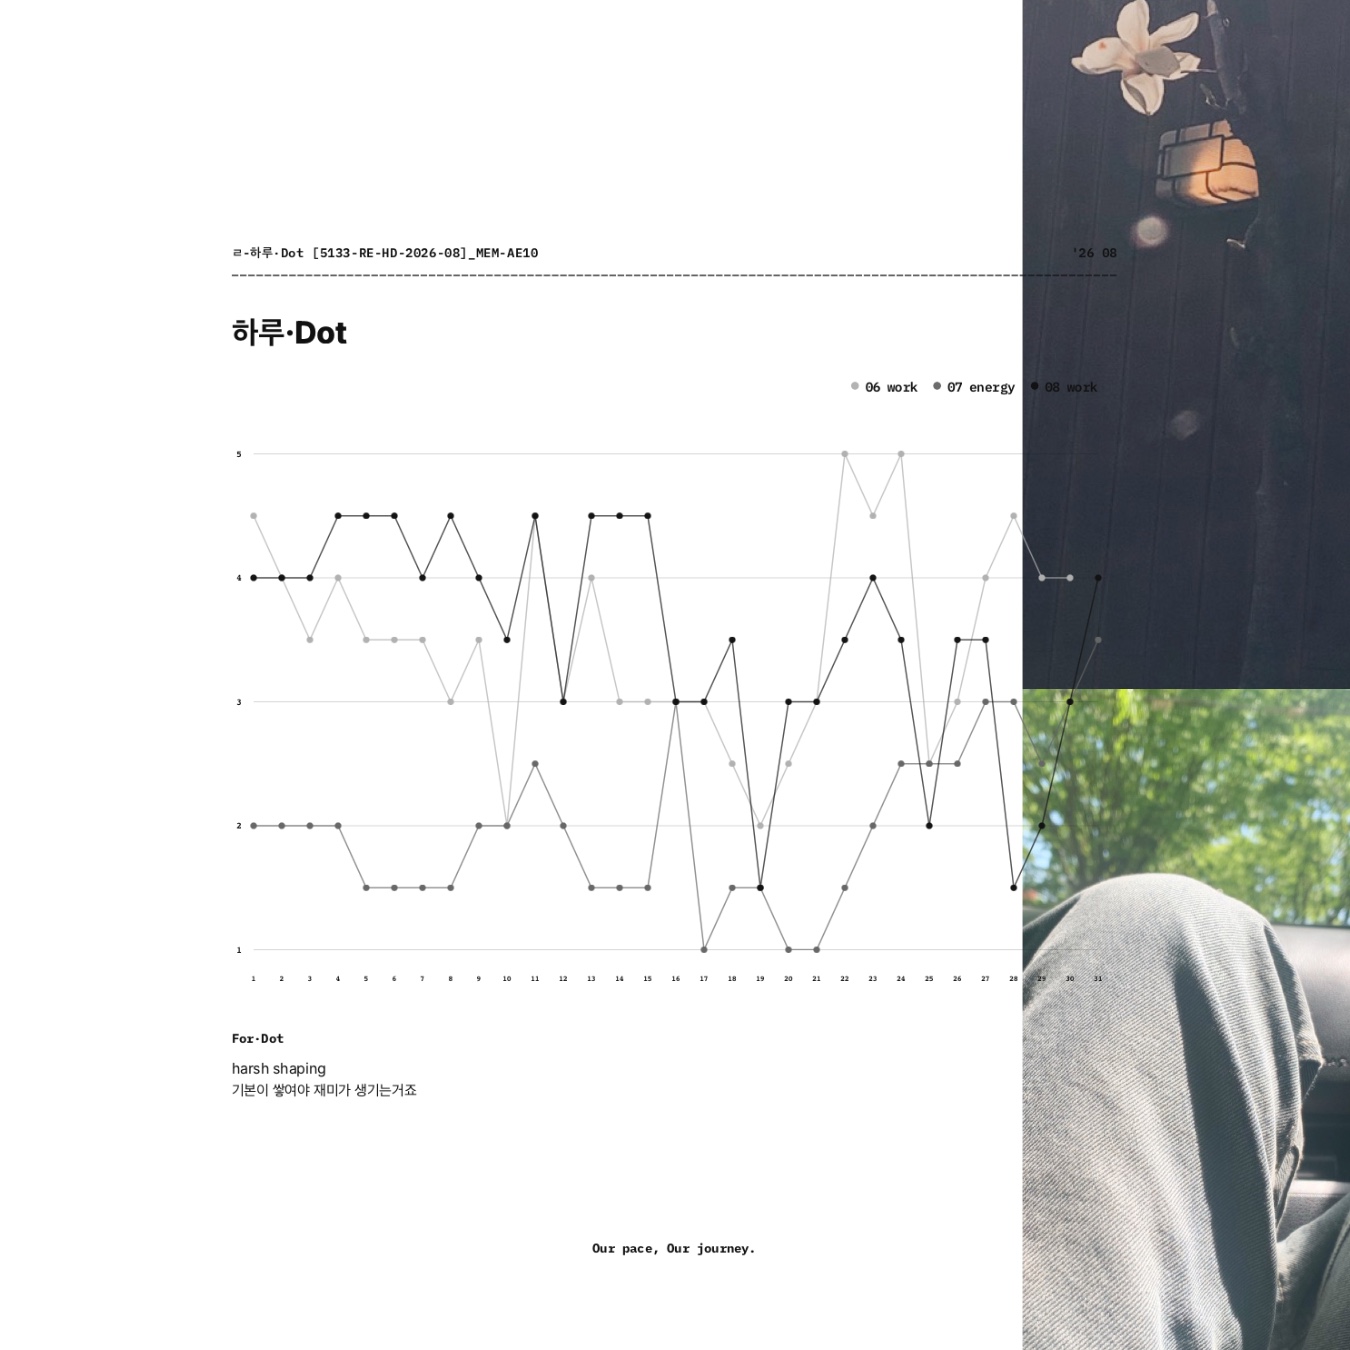
    In the August 2026 view shown below, the Lens is work.

    The individual scores move up and down across the recorded days. Seen together, they begin to form a visual flow rather than a series of isolated ratings.

    August 2026 하루·Dot 1-month view showing recorded work ratings as connected dots on a 1–5 scale beside everyday images.

    As more dots accumulate, a single score becomes easier to see as part of a larger record.

    From One Month to a Longer View

    하루·Dot lets you change the time range without changing the way you record.

    The same dot-based records can be viewed across 1M, 3M, 6M, or 1Y.


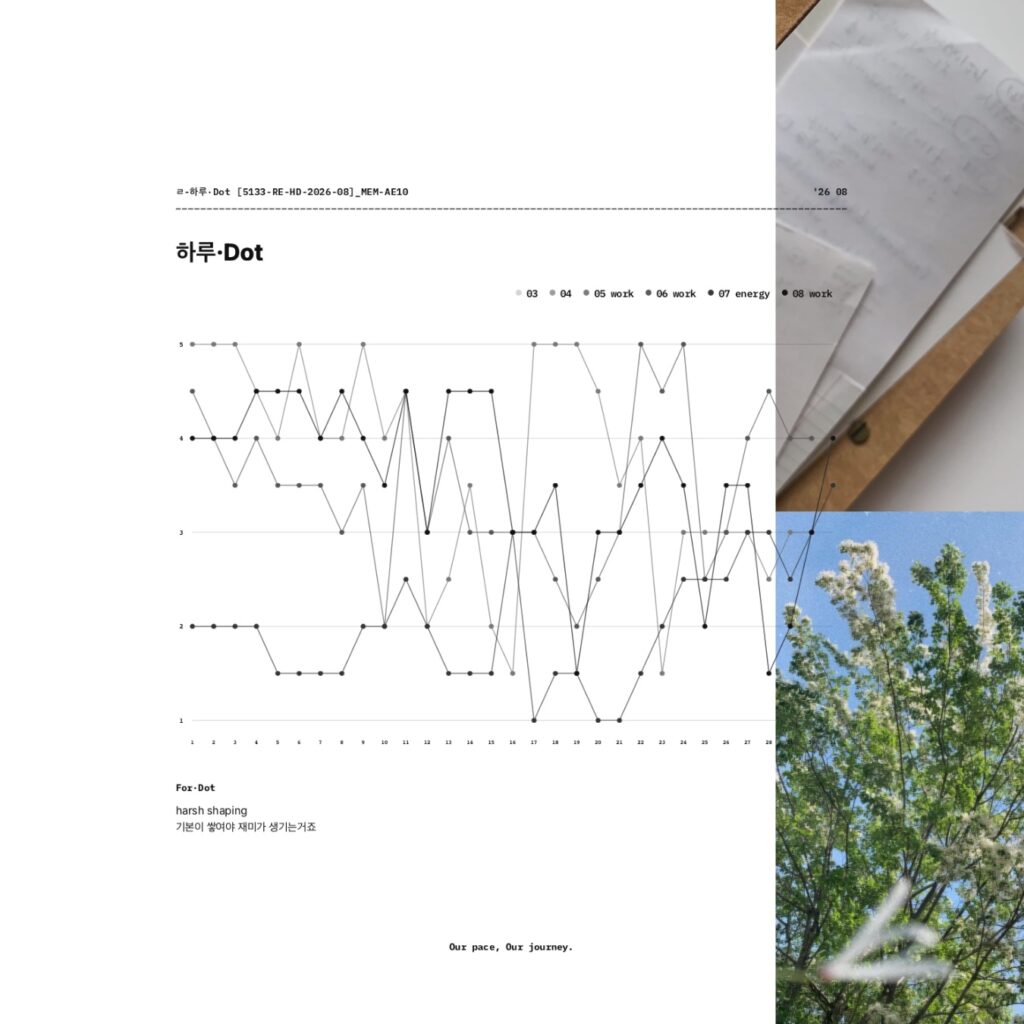
    3M — See Recent Records Together

    The 3-month view brings recent records into the same graph.

    In the Featured Image, June work, July energy, and August work appear together.

    Instead of summarizing each period in a long written entry, you can see several recent records within one view and notice how their lines sit alongside one another.


    6M — Widen the Frame

    The 6-month view places the available records within a wider time frame.

    This makes it easier to step back from individual days and see how separate entries relate across months.

    하루·Dot 6-month view showing available rating lines on a 1–5 scale beside photos of notes and green trees.

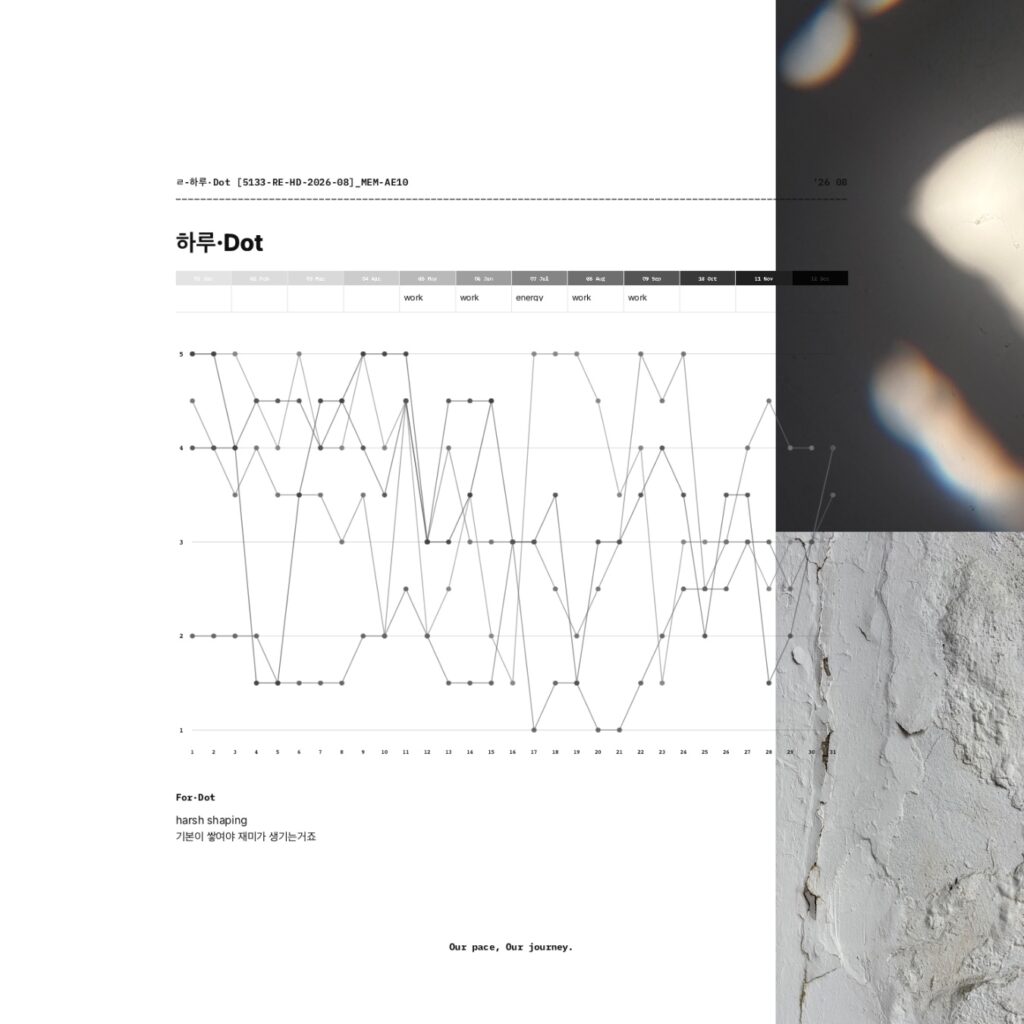
    1Y — See the Record in a Full-Year Frame

    The 1-year view gives you the widest frame available in 하루·Dot.

    By placing the record within a January-to-December layout, it becomes easier to look beyond individual days and see the overall shape of what has been recorded.

    하루·Dot 1-year view showing available rating lines within a January-to-December layout beside abstract light and textured wall photos.

    하루·Dot does not decide what those lines mean for you.

    It gives you a way to look at what you have recorded and notice what stands out from where you are now.

    Choose What the Dot Means

    There is no single required meaning for a 하루·Dot score.
    The Lens is the part you choose.

    For example, you might track:

    • Mood
    • Energy
    • Focus
    • Physical condition
    • Work

    Something specific to your own routine
    The point is not to find the “right” thing to measure.

    Choose something you want to keep noticing.

    A mood Lens can work as a lightweight mood journal.

    An energy Lens can show how your perceived energy changes from day to day.

    A work Lens can leave a simple record of how work felt during a particular period.

    The scale remains simple. The meaning comes from the Lens you give it.

    For·Dot — Add a Little Context

    Below the graph is For·Dot, a space for a short line of text.

    You can leave a word, sentence, or small note when a dot alone is not enough for what you want to remember.

    The graph keeps the flow visible.

    For·Dot adds a little context beside it.

    Can I Use 하루·Dot With Goodnotes?

    Yes.

    하루·Dot is recorded in Flowhere, but you can export the page whenever you want as:

    • PNG
    • JPG
    • PDF

    You might record part of a month in Flowhere, export that view to Goodnotes, and continue by adding handwriting, notes, or other material there.

    Or you can keep adding dots in Flowhere and export particular 1M, 3M, 6M, or 1Y views whenever you want to keep one elsewhere.

    Flowhere and Goodnotes do not have to be separate workflows.

    You can let the dot record continue to develop in Flowhere and bring any view into Goodnotes whenever that fits the way you want to journal.

    Prefer to Record the Month With Photos?

    If numbers and lines are not how you want to remember a month, BOM Grid offers another visual approach in Flowhere.

    Instead of giving the day a score, you leave photographs by date and let the month build into one photo grid.

    → Explore BOM Grid — A Monthly Photo Journal in Flowhere

    Start With Today’s Dot

    You do not need to explain the whole day.

    Choose what you want to keep noticing.

    Decide where today sits on your scale.

    Leave one dot.

    Tomorrow can be another.

    As the record grows, you can step back and see the flow taking shape.

    One dot a day. A flow over time.

    𝑶𝒖𝒓 𝒑𝒂𝒄𝒆, 𝑶𝒖𝒓 𝒋𝒐𝒖𝒓𝒏𝒆𝒚.